Crypto's Market Cap Problem: Frozen Assets, Lost Bitcoin, and the Selloff Nobody Measures Properly
A market selloff is not only about price. Frozen stablecoins and inaccessible Bitcoin expose a deeper problem: headline crypto market cap counts supply that may not actually be liquid.
Crypto selloffs usually get explained through the same surface story: leverage unwinds, liquidity disappears, macro traders cut risk, ETF flows slow, and altcoins fall harder than Bitcoin. Those explanations are not wrong. They are just incomplete. The more interesting problem is what the selloff reveals about the number everyone quotes first: market capitalization.
As of May 29, 2026, CoinGecko showed the global crypto market near $2.54 trillion, with Bitcoin dominance around 57.6% and stablecoins around $318 billion of market value. Bitcoin itself was trading around $73,700, with a reported circulating supply a little above 20.03 million BTC and a headline market cap around $1.47 trillion. Those are useful numbers for orientation. They are not the same thing as liquid value.
Market cap is a simple formula: price multiplied by reported circulating supply. It does not ask whether the coins can move. It does not ask whether a stablecoin balance is frozen by an issuer. It does not ask whether a Bitcoin private key was lost in 2012. It does not ask whether a whale wallet is active, dead, sanctioned, trapped in litigation, or functionally unreachable. In a calm market, that weakness is easy to ignore. In a drawdown, it matters, because liquidity becomes the only thing that can absorb selling.
This article is not an argument that crypto market cap is fake. It is an argument that headline market cap is a blunt metric. For FreezeRadar readers, the sharper question is this: how much of the market value we quote every day sits on assets that cannot actually be used, redeemed, sold, transferred, or defended without intervention?
Why the market is under pressure
The current weakness has several overlapping causes. The first is leverage. Crypto markets still turn small price moves into forced selling because perpetual futures and margin venues remain central to price discovery. When Bitcoin breaks support, liquidations push more spot and derivatives selling into a thin book. That is not a deep thesis; it is market plumbing.
The second cause is rotation. When traders can earn yield elsewhere, or when equities look stronger than digital assets, capital leaves high-beta crypto first. Analysts watching the late-May move pointed to weak volume, pressure on altcoins, and a market waiting to see whether broader risk assets would keep outperforming crypto. That matters because Bitcoin may be the anchor, but altcoins and long-tail tokens often carry the more fragile liquidity.
The third cause is confidence. After a strong cycle, buyers start to treat previous support levels as obvious. When those levels fail, the same crowd discovers that market cap is not a cash cushion. A token can show a $10 billion market cap and still have very little real bid depth. A stablecoin can show billions outstanding and still contain addresses that cannot move because of issuer controls. Bitcoin can show a $1.47 trillion cap while millions of coins may never re-enter the market.
That last point is the one most market commentary misses.
The market cap formula hides dead supply
Market cap works cleanly only when the counted supply is economically available. Equity markets have free-float adjustments for a reason: shares locked by insiders, governments, foundations, or strategic holders do not behave like shares available to trade. Crypto often quotes the broader number first.
For Bitcoin, the protocol supply is transparent. The spendability of each coin is not. A coin can sit in a UTXO forever because the owner is patient, because the owner is dead, because the key is gone, because the device was destroyed, or because the coins were intentionally sent to an unspendable address. On-chain inactivity alone cannot prove loss. But the range of serious estimates is large enough that market-cap analysis should not ignore it.
Ledger’s 2025 review, citing Chainalysis estimates, put permanently lost Bitcoin in a range of roughly 2.3 million to 3.7 million BTC, or about 11% to 18% of the 21 million cap. At a Bitcoin price near $73,700 on May 29, 2026, that lost-coin range represents about $170 billion to $273 billion of headline BTC market cap sitting on coins that may be economically dead.
That does not mean Bitcoin is overvalued by exactly that amount. Price is set at the margin, and the market may already partially price in the scarcity effect of lost coins. It does mean that headline BTC market cap overstates the value of coins that could actually be mobilized if the market needed liquidity.
Lost Bitcoin makes the remaining float scarcer
There are two ways to interpret lost Bitcoin. The bullish framing is that lost coins make remaining coins scarcer. Satoshi’s old line captures the idea: lost coins are effectively a donation to everyone else. If 2.3 million to 3.7 million BTC are gone forever, the accessible supply is lower than the protocol supply, and each remaining coin has a stronger scarcity claim.
The risk framing is different. If the market quotes capitalization against all mined coins, then part of the cap is assigned to inventory that cannot respond to price. It cannot be sold into rallies. It cannot be deposited as collateral. It cannot be used to meet redemptions. It cannot cushion a liquidity shock. The result is a market that may look deeper on paper than it is in practice.
This is why selloffs can feel violent even when headline market cap is enormous. The liquid part of the market is smaller than the reported capitalization. Exchanges, ETF flows, market makers, miners, treasuries, derivatives books, and active holders determine the live float. Lost coins do not.
Frozen stablecoins create a different market-cap distortion
Stablecoins add a second version of the same problem. USDT, USDC, PAXG, XAUt, and similar issuer-controlled assets are not like Bitcoin. Their supply can be frozen or blacklisted at the smart-contract or issuer level. That is the core FreezeRadar theme: token balances can exist on-chain while being unable to move.
Tether said on April 23, 2026 that it supported a U.S. Government freeze of $344 million USDT across two addresses. The company also said it works with more than 340 law-enforcement agencies across 65 countries and that its cooperation had led to more than $4.4 billion in assets being frozen. Reuters reported earlier in 2026 that Tether’s total frozen assets linked to illicit activity had reached $4.2 billion, including $3.5 billion frozen since 2023.
Those are not theoretical numbers. They show that stablecoin intervention is already material. Against a USDT market cap around $189 billion on May 29, 2026, $4.4 billion of frozen assets would be roughly 2.3% of USDT’s headline market cap. Against total crypto market cap near $2.56 trillion, it is only about 0.17%. That sounds small at global scale, but it is huge if you are analyzing stablecoin liquidity, issuer intervention risk, or the counterparty exposure of a specific wallet.
The important distinction is that frozen stablecoins are not the same as lost Bitcoin. Lost Bitcoin is usually irreversible and decentralized. Frozen stablecoins are issuer-mediated and may later be seized, reissued, burned, redeemed, or redirected depending on legal process and issuer policy. But while they are frozen, they are not liquid user balances. If market data still counts them as circulating supply, the headline market cap can overstate the amount of stablecoin value freely available to the market.
The rough haircut: $174 billion to $277 billion of questionable headline cap
A simple back-of-the-envelope calculation helps frame the issue:
- Estimated lost Bitcoin: 2.3 million to 3.7 million BTC.
- Bitcoin price on May 29, 2026: roughly $73,700.
- Implied inaccessible BTC value: about $170 billion to $273 billion.
- Tether-reported frozen assets: more than $4.4 billion.
- Combined inaccessible or frozen value in just these two buckets: about $174 billion to $277 billion.
Measured against a global crypto market cap around $2.56 trillion, that range equals roughly 6.8% to 10.8% of the entire market. This is not a perfect free-float adjustment. It excludes dormant-but-not-lost BTC, exchange reserve concentration, locked staking, vesting schedules, foundation treasuries, bridge-wrapped assets, seized assets, bankrupt estate wallets, and frozen balances outside Tether. It also assumes lost-BTC estimates are directionally useful but not precise.
Still, the point is hard to ignore: a meaningful share of the market value crypto quotes may be tied to supply that is not economically available.
Why this matters during a crash
When markets rise, dead supply can be bullish. It reduces sell pressure and reinforces scarcity narratives. When markets fall, dead supply can be misleading. It gives the impression that there is more value available to absorb shocks than there really is.
A market cap of $2.5 trillion does not mean $2.5 trillion can exit. It means the last traded prices, multiplied across reported supplies, produce that number. If only a small fraction of holders sell, the price can move dramatically. If leverage is layered on top, the move can accelerate. If stablecoin liquidity is concentrated in issuer-controlled assets, counterparty and freeze risk can become part of the liquidity story.
For treasury teams, this matters in three places:
- Collateral valuation: collateral that cannot move is not collateral you can liquidate.
- Counterparty review: a wallet with frozen stablecoins is not merely illiquid; it may be legally or compliance-sensitive.
- Market-risk reporting: headline market cap should not be treated as a proxy for executable liquidity.
That is where crypto risk management has to mature. The useful question is not only “what is the token worth?” It is “can this specific balance move, settle, redeem, or be accepted by a counterparty without creating sanctions, issuer, or operational risk?”
The stablecoin angle: freeze risk is becoming market structure
Stablecoins are now central to crypto trading, OTC settlement, DeFi liquidity, remittances, and exchange collateral. That means issuer intervention is no longer a niche compliance topic. It is market structure.
If a major stablecoin issuer freezes funds tied to sanctions, fraud, or law-enforcement requests, that action can protect victims and block illicit finance. It can also expose how dependent the market is on centralized control points. The same feature that helps stop stolen funds can make certain balances non-transferable instantly. For honest users, the risk is usually indirect: receiving funds from the wrong counterparty, interacting with a tainted broker, or accepting stablecoins whose upstream history later becomes a problem.
This is why FreezeRadar keeps returning to wallet-level monitoring. The market does not freeze in aggregate. Specific wallets freeze. Specific token contracts enforce restrictions. Specific counterparties create exposure. If you only watch price, you miss the operational risk until it lands in your address.
Readers who want the foundation should pair this article with our guides on freezeable assets, stablecoin compliance, and wallet monitoring strategy. Those pieces explain how issuer controls and sanctions exposure move from abstract policy into real wallet operations.
What investors and operators should watch next
The next crypto drawdown will not be explained by one cause. It will come from the same stack of pressures: leverage, liquidity, macro rotation, narrative fatigue, regulatory shocks, and forced selling. But the more durable lesson is about supply quality.
Operators should track these questions:
- How much of a token’s market cap is actually free float?
- Are frozen balances still counted in circulating supply?
- How much liquidity sits in issuer-controlled stablecoins?
- Are treasury wallets exposed to blacklisted, sanctioned, or frozen counterparties?
- Are old, dormant, or unrecoverable wallets being treated as if they are liquid supply?
- Does collateral policy distinguish between market value and transferable value?
For Bitcoin, the answer is mostly about lost keys, dormant supply, and exchange liquidity. For stablecoins, it is about issuer controls, sanctions, redemption rights, and law-enforcement coordination. For tokenized assets, it is about both: legal control and market depth.
Key takeaway
The crypto market cap number is useful, but it is not clean. It counts supply that may be lost, frozen, inaccessible, locked, or operationally unusable. During bull markets, that can make scarcity look stronger. During selloffs, it can make the market look deeper than it is.
A sharper metric would separate headline market cap from accessible, transferable, legally usable float. Until the industry does that consistently, investors and treasury teams should apply their own haircut. On May 29, 2026 numbers, lost Bitcoin alone implies roughly $170 billion to $273 billion of headline BTC market cap attached to coins that may never move again. Add known frozen USDT, and the questionable-cap bucket is already in the high hundreds of billions before we even touch other locked or impaired supply.
That is not a reason to dismiss crypto. It is a reason to measure it honestly.
References
- CoinGecko Global Cryptocurrency Market Cap Charts - market cap, BTC dominance, and stablecoin share observed on May 29, 2026.
- CoinGecko Bitcoin price and market data - BTC price, circulating supply, and market cap observed on May 29, 2026.
- Tether supports freeze of more than $344 million in USDT in coordination with OFAC and U.S. law enforcement - Tether, April 23, 2026.
- Tether says it has frozen $4.2 billion of its stablecoin over crime links - Reuters via Investing.com, February 27, 2026.
- How Many Bitcoin Are Lost? - Ledger Academy, updated November 19, 2025.
- Why Is the Crypto Market Down Today? - CCN market analysis, May 26, 2026.
Image and source notes
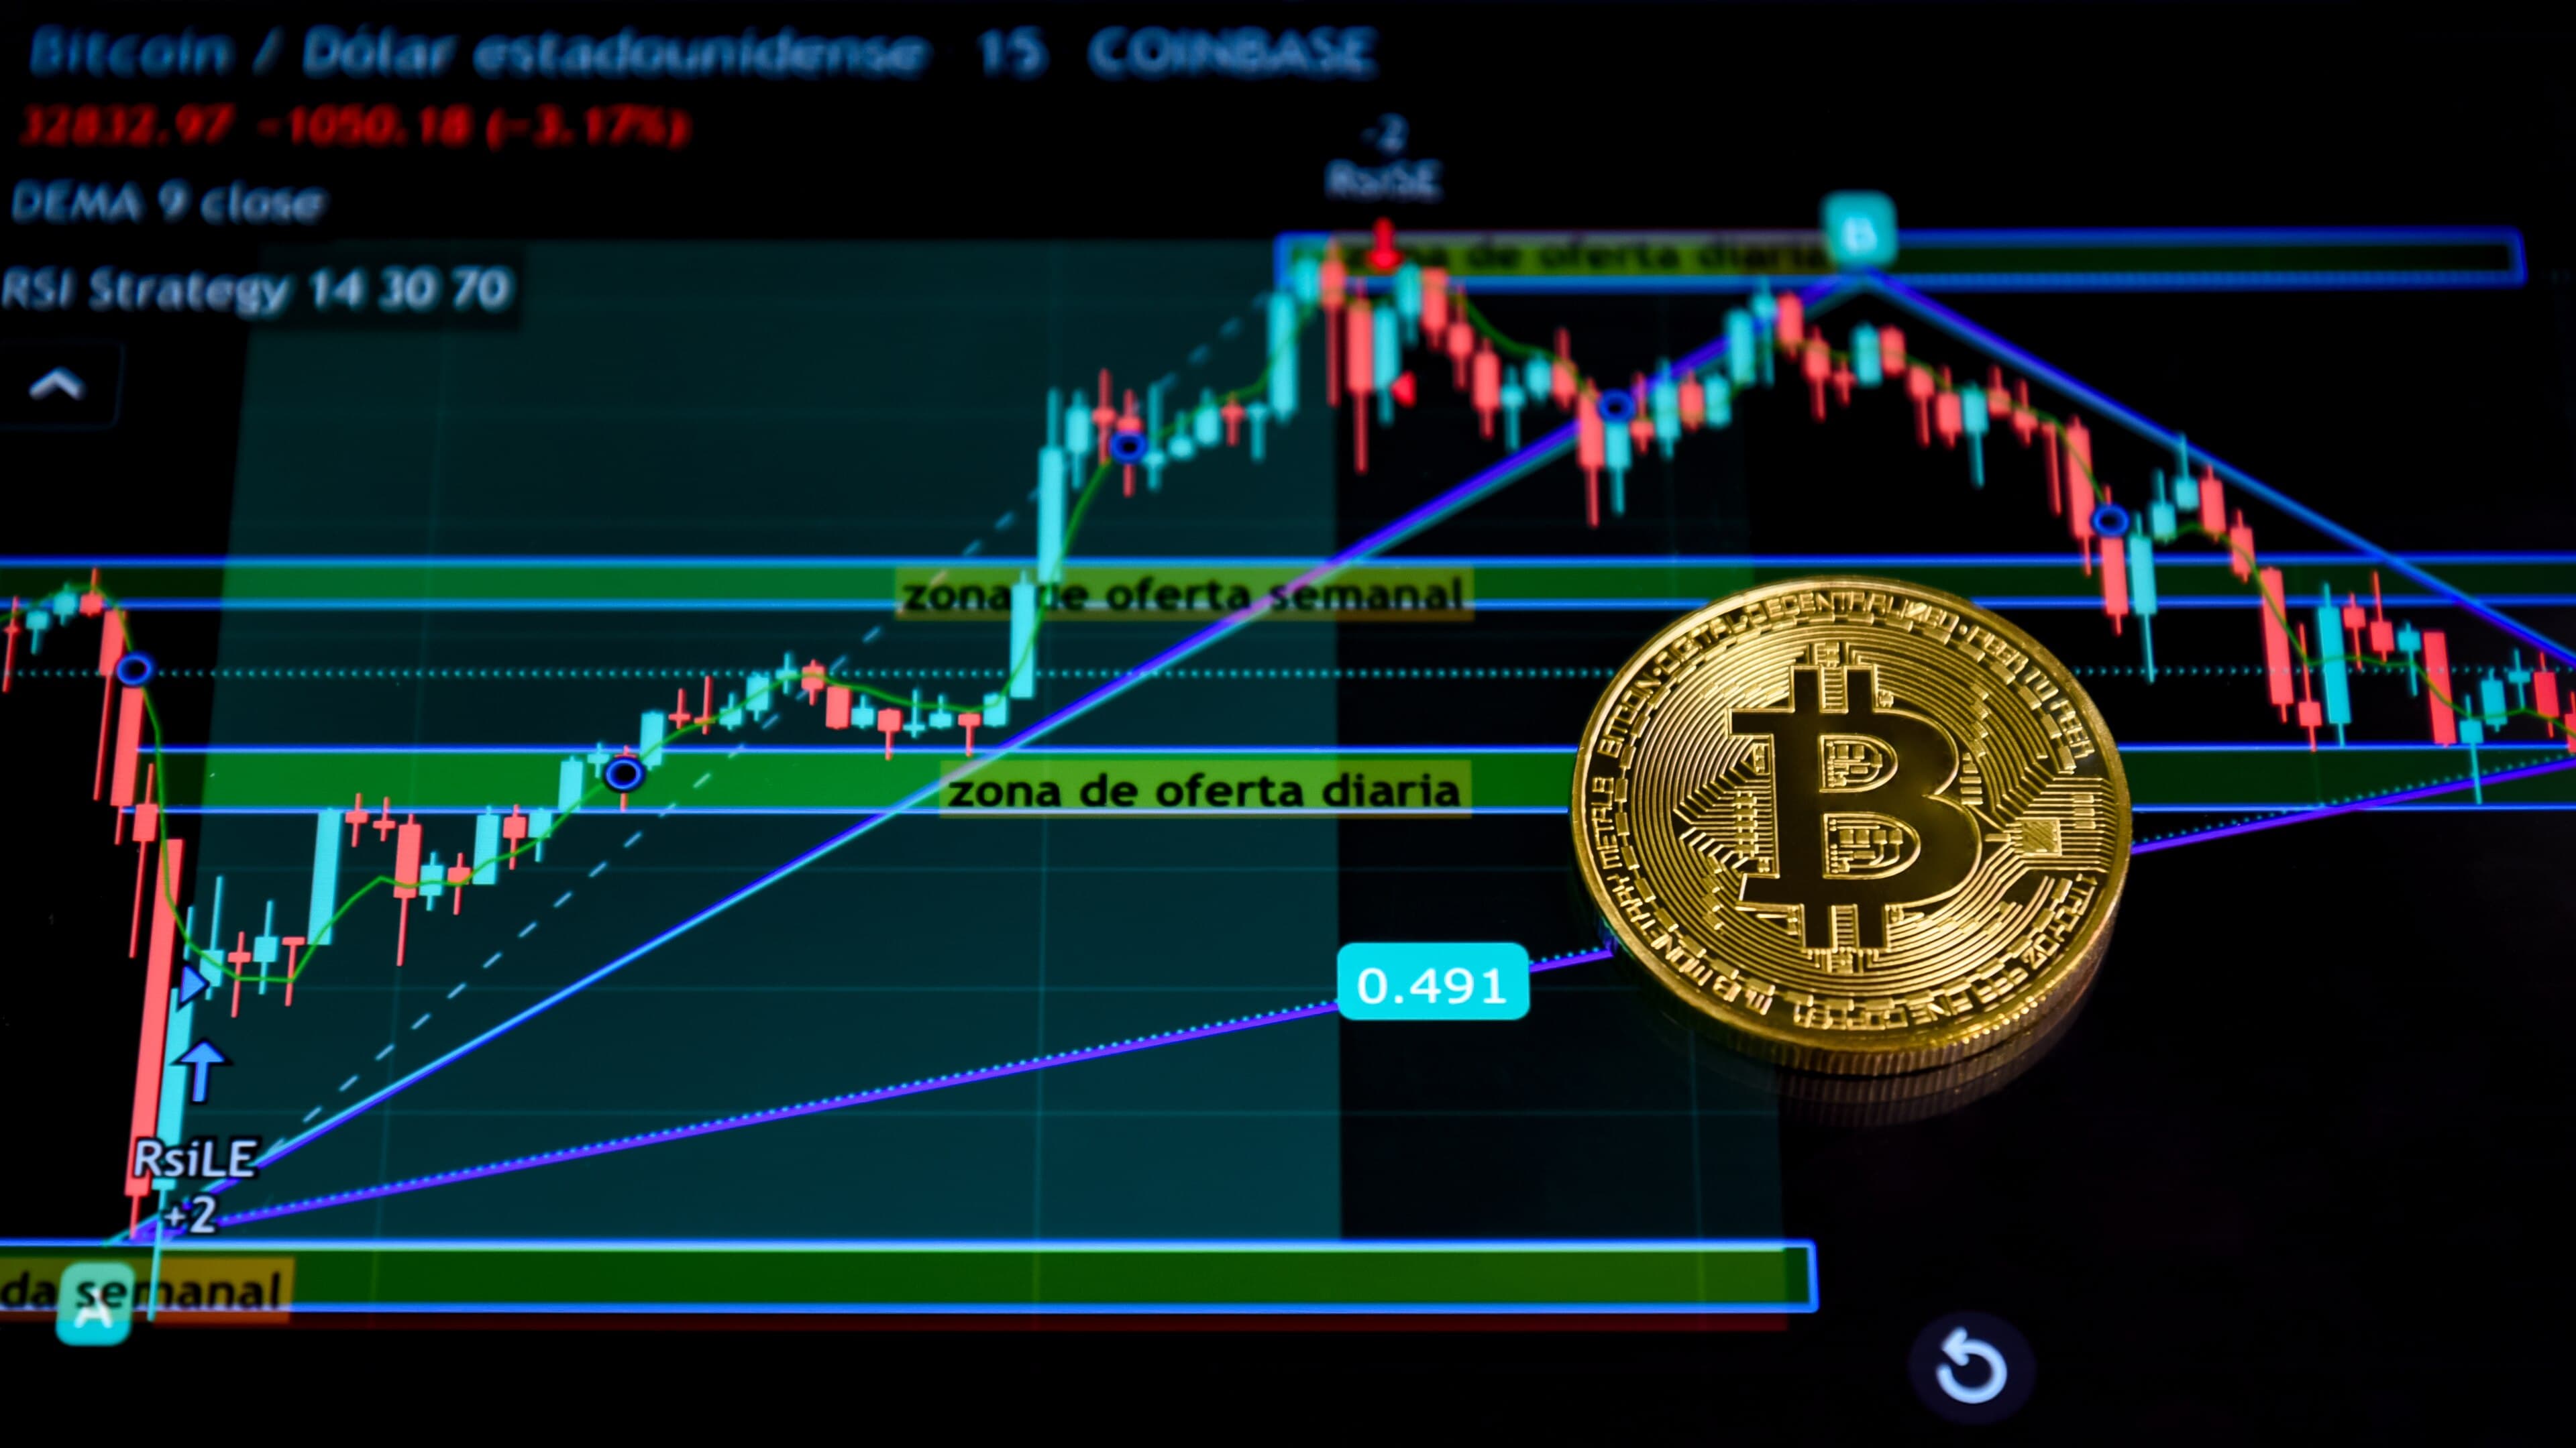
Cover image: Wikimedia Commons file Bitcoin (50799812413).jpg, credited to Jorge Franganillo, Creative Commons Attribution 2.0 Generic license. Local file: /content-media/crypto-market-cap-bitcoin-cover.jpg.
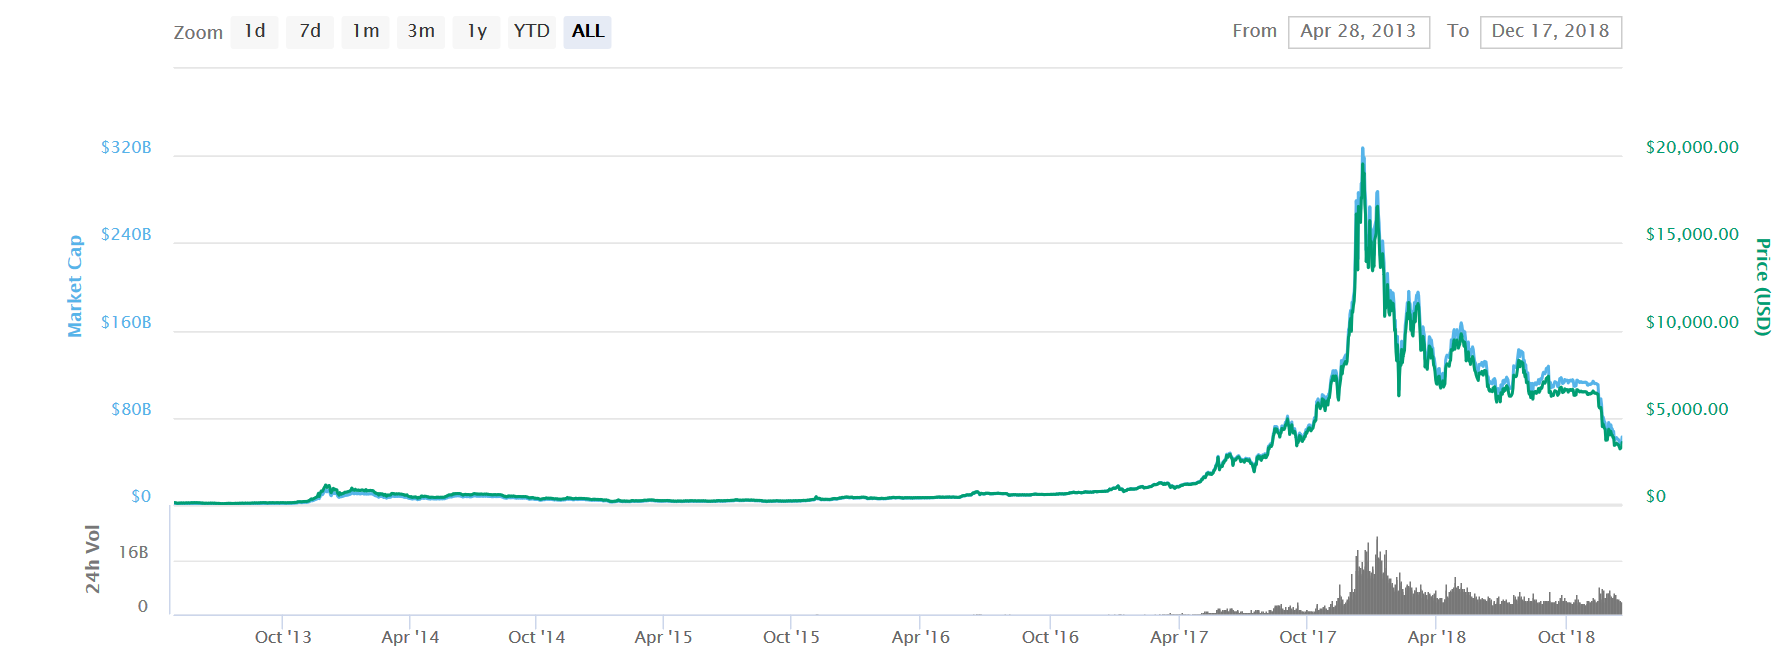
Inline chart: Wikimedia Commons file Bitcoin price chart.png, public-domain chart because it consists of common factual data without original authorship. Local file: /content-media/crypto-market-cap-bitcoin-price-chart-inline.png.
Sources
CoinGecko Global Cryptocurrency Market Cap Charts
CoinGecko
Global market cap, BTC dominance, and stablecoin share observed on May 29, 2026.
CoinGecko Bitcoin price and market data
CoinGecko
BTC price, circulating supply, and headline market cap observed on May 29, 2026.
Tether supports freeze of more than $344 million in USDT in coordination with OFAC and U.S. law enforcement
Tether
Primary issuer announcement on a large USDT freeze and law-enforcement coordination.
Tether says it has frozen $4.2 billion of its stablecoin over crime links
Reuters via Investing.com
Reported total frozen USDT linked to illicit activity as of February 2026.
How Many Bitcoin Are Lost?
Ledger Academy
Lost Bitcoin estimate range and explanation of inaccessible coins.
Why Is the Crypto Market Down Today?
CCN
Market context around late-May 2026 crypto weakness and liquidity pressure.
By FreezeRadar Team
Research and product team behind FreezeRadar.